
We have released anyLogistix 3.0 – a major new version of the supply chain analytics software that helps design, optimize, and analyze a company’s supply chain. You can already download it from the website. Meanwhile, see what it has to offer.
anyLogistix 3.0 is a client-server application, that allows you to connect to a local server or a server in a private cloud to run experiments from your computer using a browser. You don’t have to worry anymore if your laptop is powerful enough – just open Chrome or any other browser and start working on your project right away. Server installation is currently available for Linux.
For those who prefer offline access to their projects, you could still use a Windows desktop installation. We are also pleased to present a desktop version of anyLogistix for macOS users.
Moving the user interface to the web allowed us to renew and improve the appearance of the whole software. With the interface changes and updated design, working in anyLogistix 3.0 has become smoother and more intuitive.
The new technologies used in anyLogistix 3.0 have enhanced the software’s performance. It’s now easier and quicker to set up the map, dashboard, and tables before you run an experiment (even in large projects!). You don’t need to worry about your computer’s RAM being overloaded with data.
Database
PostgreSQL is now the built-in database for anyLogistix. Having one database instead of four has contributed to the software’s performance, so anyLogistix 3.0 runs faster overall.
Multilanguage support
The interface currently supports English and Chinese.


anyLogistix 3.0 interface: in English (left) and Chinese (right). Click to enlarge
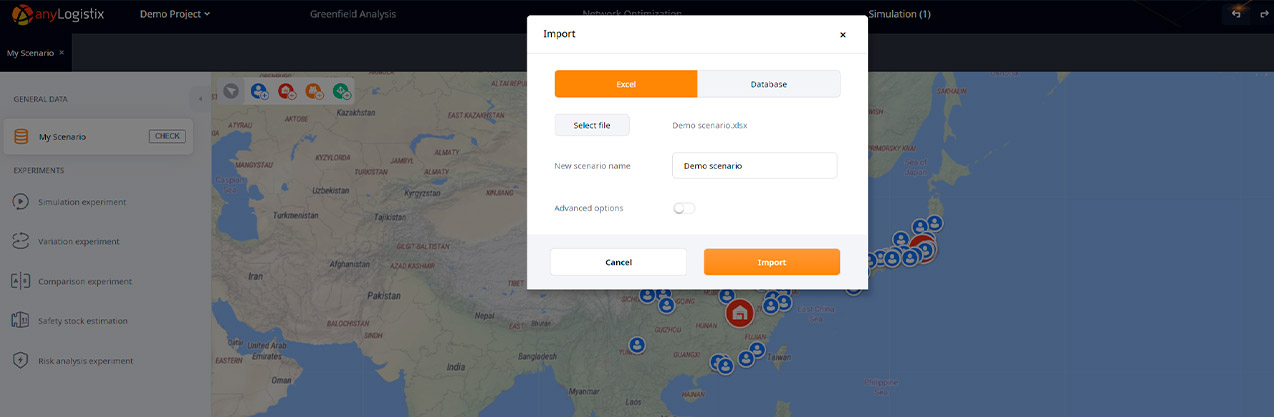
Import/Export scenario improvements
You can just drag-and-drop scenarios to import them. As easy as it sounds:
Dragging and dropping scenarios in anyLogistix 3.0
In anyLogistix 3.0, you can also work on other projects while one of your scenarios is importing in the background. There’s no need to wait for it to go on with your work.
Dashboard
You can export data from your project to an MS Excel file. There are two options for how you can export statistics from experiment results: either as raw or plotted data. The first option exports the source data generated by the experiment you’ve run. The second option exports data to an MS Excel file with user-defined settings (as it is on the dashboard). Choose whatever option best suits your requirements.

Exporting statistics from experiment results: either as raw or plotted data
In addition, when you create a chart in anyLogistix 3.0, you can see in the preview window how it will look like with your data from experiment results. This helps you to choose the most appropriate and appealing way to present your data and communicate the findings.
This is a short list of all the release features. Find out more about the changes in the Release Notes section of the Help website.
Can’t wait to experience the renewed anyLogistix? Download it now to get started!