Learn how a powerful supply chain planning tool can support your strategic and tactical decisions.

Creating and maintaining a result-oriented, efficient supply chain can be tricky since it brings together the procurement, production, transportation, sales, and financial sides of your business. This is where optimization can help.
In this article, we explore what ‘supply chain optimization‘ means, look at the typical supply chain management and optimization problems, and go through a practical example to learn how to solve those problems.
Contents:
Many definitions of supply chain optimization exist but all generally fall into two categories:
In this article, we will focus on the narrower term, because it is the one that usually causes the most confusion, and we will show you how to perform supply chain network optimization.
Network optimization, as a quantitative approach, combined with management-based qualitative methods (case study research, action research, etc.) helps solve various supply chain challenges. Managers typically divide those challenges into three levels:
Optimization usually deals with the problems on the first two levels – strategic and tactical. Let us have a closer look at them.
Learn how a powerful supply chain planning tool can support your strategic and tactical decisions.
Supply chain design – Includes finding optimal locations for new facilities (distribution centers, warehouses, and plants), defining the flows between them, and balancing costs. An optimal supply chain design should be reliable, cost-efficient, and ready to deal with supply and demand uncertainty.
Master planning by period– Its goal is to align production, storage, and transport with demand fluctuations. When aligned, they help maximize a supply chain’s efficiency, cut costs, and increase profit.
Transportation – The objective is to transport products from one facility to another (from warehouses to customers, for example) while satisfying supply and demand and keeping the transportation costs at the lowest level.
Now let us see network optimization in action.
From the supply chain network optimization example below, you will learn to:
Linear and mixed-integer programming are commonly used methods for solving supply chain optimization challenges. While many companies use MS Excel to implement these methods, we would like to show a more efficient and easier way to solve the same supply chain problems in anyLogistix software.
A company acquires sunflower oil factories in several countries and wants to merge its supply chains. These are zero-waste factories that produce sunflower husk and pressed cake as by-products. The by-products are then further processed into fuel and animal food.
A supply chain network design for the model consists of Suppliers (which transfer raw materials to factories), Factories, Distribtion centers (DCs), Ports (used to transfer products by sea), and Customers. The screenshots below show this network’s structure and on-map view.


The supply chain’s on-map view (left) and its network’s structure (right) in anyLogistix supply chain optimization software (click to enlarge)
Distribution Centers, Factories, and Ports
Products

Production of the main and the by-products in the supply chain optimization model
Demand
We have a demand forecast for the next three years. The demand
Demand also varies for each product. If demand fails to get fulfilled, penalties (or SLA violation fees) per product unit are charged.
Paths
Vehicles
The dilemma lies in the balance between demand and production for both the main products and by-products.
If we try to completely fulfill demand for the main products, we end up with too many by-products than required to meet demand and must therefore find storage for them, at a cost.

After running the scenario, we see that the demand for oil is completely fulfilled, however, inventory carrying costs for husk are charged
Alternatively, the company can choose to reduce the production volume. In this case, factories only produce a certain amount to avoid expenses for storing unsold main products. Average demand is fulfilled this way but demand peaks are not. Eventually, the company will have to pay SLA penalties.

After running the scenario, we see that while the average demand for oil is satisfied, the company fails to do that during demand fluctuations. As a result, SLA penalties are charged
Network optimization aims at finding the best configuration alternatives for our sunflower oil supply chain. While striving to reach the optimal balance between demand and production, it also considers our costs, penalties, and other constraints. For example, it takes into account the total amount of DCs that we can include in our network and the maximum throughput of the factories.

Statistics for the three supply chain optimization scenarios described earlier. Compare (Inventory) Carrying costs, Penalties, and Objectives (profit in US dollars)

Statistics for the three supply chain optimization scenarios described earlier. Compare Demand fulfillment (in %) and Penalties
Running the network optimization experiment for the sunflower oil supply chain model in anyLogistix, provides several network configurations with detailed statistics.
For example, the statistics show that during the first modeled year, the demand for sunflower oil was completely satisfied, while for the by-products, it was only partially satisfied. Therefore, no penalties are charged for oil, as you can see in the table below.

During the first modeled year, the demand for sunflower oil was completely satisfied, while for the by-products, it was only partially satisfied
Producing additional batches to completely satisfy demand for the by-products would have created an excess of the main product. This, in turn, would result in extra storage costs and decrease supply chain operation profits.
The result of this supply chain optimization example is a three-year production plan that was calculated considering all constraints. This optimization example can be adapted and applied to your real supply chain tasks.
Together we have explored what supply chain optimization means and the problems it solves. Now what?
To start, download the the sunflower oil example and import it in anyLogistix Studio Edition (File → Import → Import Scenario from File or follow the guide). Then explore the network structure, and examine the tables to see all the settings and parameters for the supply chain. Finally, you can run the optimization experiment in anyLogistix and analyze the results yourself.
If you don’t have anyLogistix Studio, we recommend you watch these short videos on related supply chain optimization topics and try the corresponding examples yourself in anyLogistix PLE for free.
Supply chain master planning
Learn how to organize a two-tier network and estimate the amount of product a cheese plant should produce each month.
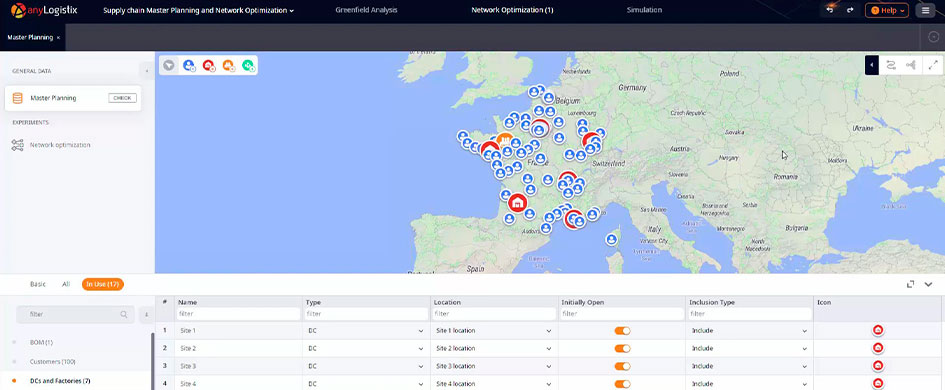
See the example’s description in anyLogistix Documentation
Global network optimization
Discover how to organize a multi-tier network. The goal of this example is to find the best configuration of DCs while considering transportation, initial, carrying costs, and the list of locations where a company could build warehouses.
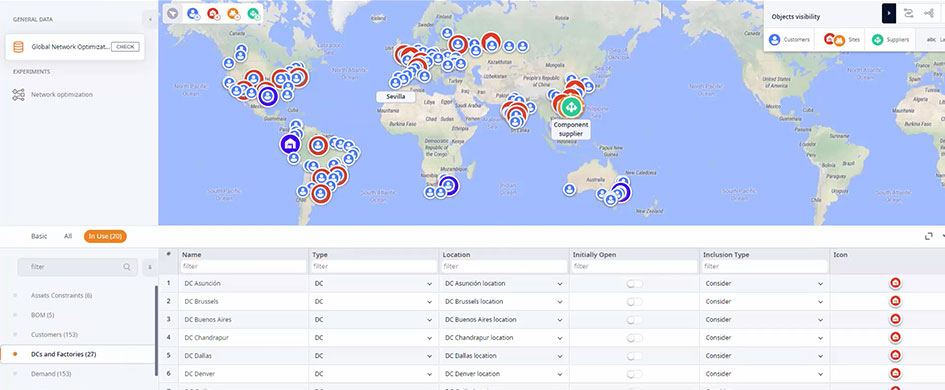
See the example’s description in anyLogistix Documentation